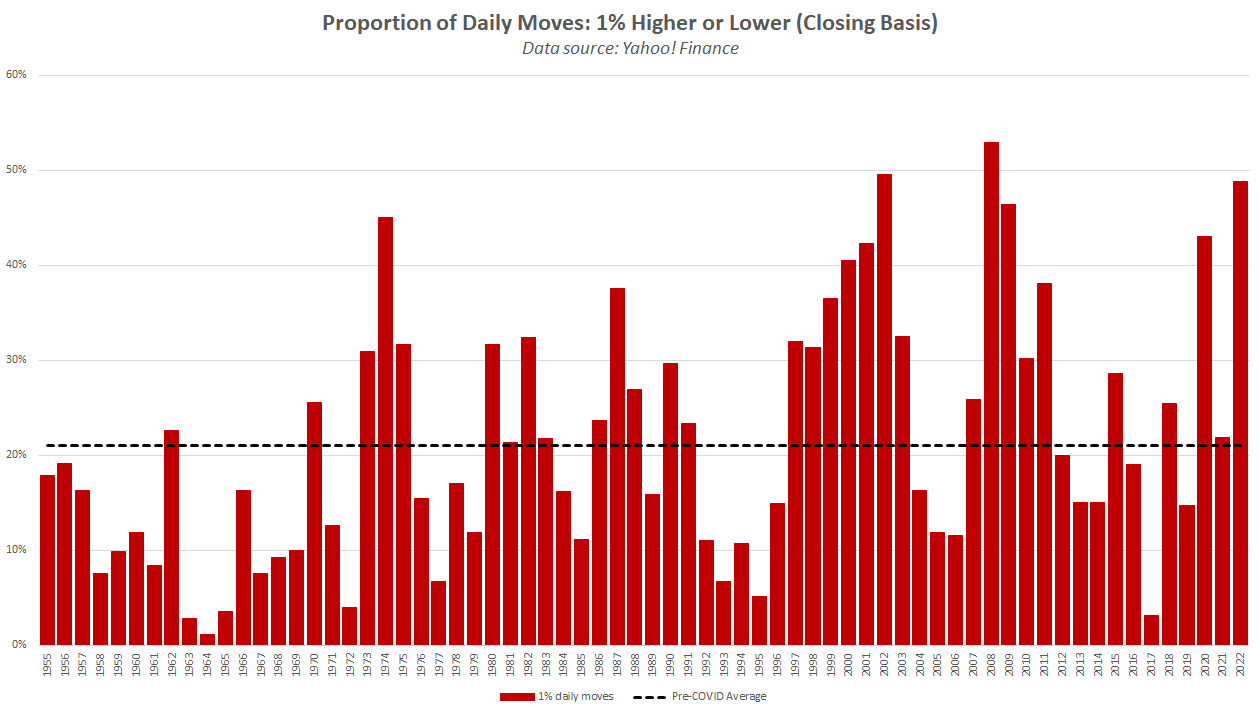
Stock market volatility has been extremely elevated during the first few months of 2022. For example, roughly half (49 percent) of the trading days so far this year have seen the S&P 500 move higher or lower by at least 1 percent.
That surpasses the COVID-related spike in volatility seen in 2020 and is exceeded only by the Global Financial Crisis and post-9/11 market environments. This year’s wild swings in equity valuations began as concerns about inflation and the Federal Reserve’s subsequent response started to grow, and then the crisis in Ukraine provided an unneeded catalyst for further selling. As a result this has been one of the worst starts to a year for stocks in history. The good news is that a lot of forced selling has already occurred, i.e. people who had to sell due to margin calls or other requirements already did so, and as a result stocks have since rallied significantly off of the February lows.
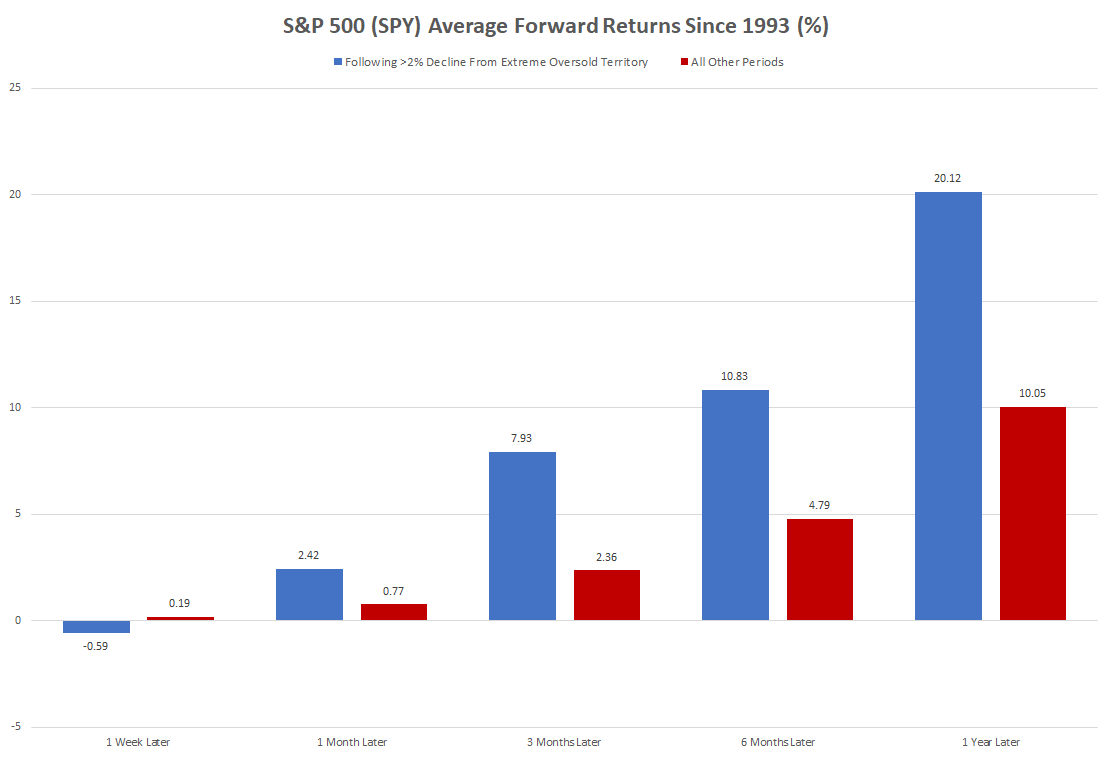
Although the market bounce is welcome and in many ways unsurprising, investors may still be worried that the likelihood of another sharp selloff remains elevated. Such concerns are understandable since the issues of inflation and geopolitical tensions have yet to be completely resolved, and there are indeed many other potential catalysts for another equities drawdown. The following statistics, though, may be comforting for less-experienced investors. For example, the S&P 500 was already in “extreme oversold territory” (more than two standard deviations below 50-day moving average) prior to the morning after Russian forces first moved into Ukraine. The benchmark index gapped down at the open another 2.59 percent following the initial incursion and then in a significant intraday reversal ended the day up 1.50 percent. If we look at past occasions when the index plunged by more than 2.00 percent at the open after already being in extreme oversold territory, forward returns are quite encouraging. Indeed, one month after such an event, the S&P 500 on average ended up 2.42 percent versus up just 0.77 percent during all other periods (since 1993). The capitulation statistics improve as the time horizon lengthens, e.g. one year following such a 2 percent decline the index was on average up 20.12 percent compared to “just” 10.05 percent for all other periods. This is another example of how regular investors can often improve their long run outcomes by minimizing the frequency with which they check their account balance.
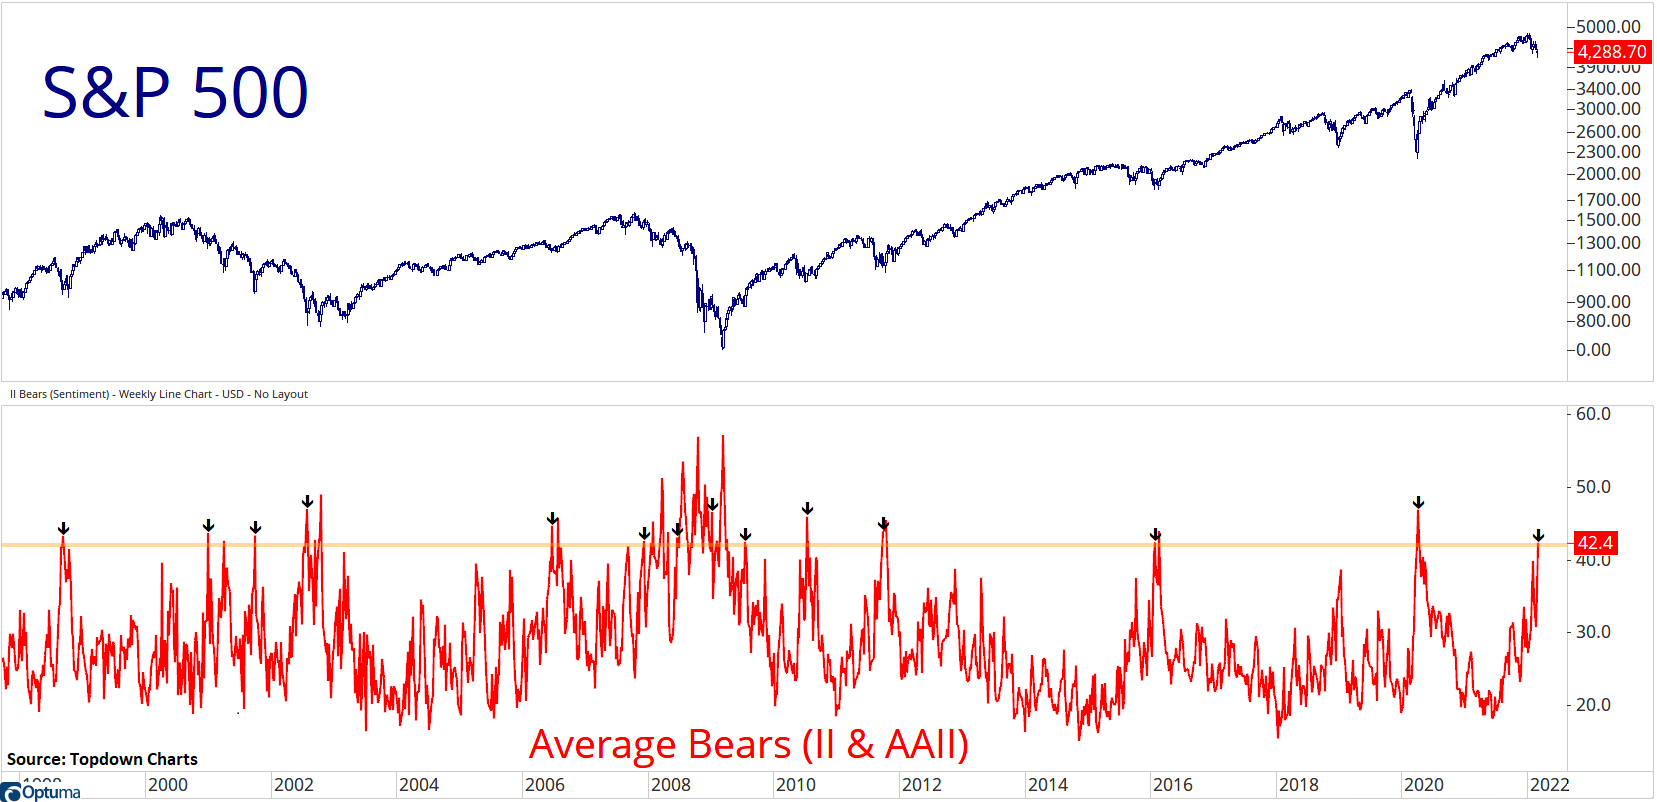
General investor confidence has also turned sharply more pessimistic in recent weeks, with the AAII Bearish Sentiment index rising to 53.7 percent in February, the highest reading seen since 2013, which many will view as a contrarian indicator. Similarly, although additional selling is still very much a possibility there is a long history of the probability of something happening in the market and the severity of what actually does occur being overestimated by regular investors, according to a well-known academic study. Indeed, on October 19th, 1987, the S&P 500 plunged by over 20 percent, the largest single-day drop on record. Ever since then the researchers have been polling investors on the perceived odds of a similar market event happening within the next six months. Over the roughly three-decade sample period respondents have typically assessed the likelihood of a comparable crash as being around 10-20 percent. Given that there have so far been zero “Black Mondays” since 1987 (even including the market turbulence of the past two years), investors were clearly overestimating the probability of a repeat occurrence. This exaggeration was found to be even greater when an adverse event was being widely covered by the financial media, e.g. surveyed investors would often assign a significantly higher crash likelihood if asked during or soon after a big down day in the market.
That is just one of the many examples of how investors will frequently rely on easily-recalled information to estimate the probability of something occurring. The researchers also found that crash assessments can negatively influence equity flows (exacerbate the flight to and from risk assets), especially when investors give excessive weight to short-term fluctuations in the market. Such irrationality can lead to people having too low a portfolio allocation in stocks simply because equities have been under pressure, and too high an allocation after a favorable period for the market. Altogether, this study is yet another reason why regular investors should stay focused on the long-term, refrain from making emotion-based trading decisions, and maintain a portfolio that is appropriate for their risk tolerance, nearness to retirement, and other unique circumstances. As always, we are here to help with any questions you may have.
What To Watch This Week:
Monday
- Consumer Credit 3:00 PM ET
Tuesday
- NFIB Small Business Optimism Index 6:00 AM ET
- International Trade in Goods and Services 8:30 AM ET
- 3-Yr Note Auction 1:00 PM ET
Wednesday
- MBA Mortgage Applications 7:00 AM ET
- JOLTS 10:00 AM ET
- EIA Petroleum Status Report 10:30 AM ET
- 10-Yr Note Auction 1:00 PM ET
Thursday
- CPI 8:30 AM ET
- Jobless Claims 8:30 AM ET
- EIA Natural Gas Report 10:30 AM ET
- 30-Yr Bond Auction 1:00 PM ET
Friday
- Consumer Sentiment 10:00 AM ET
- Quarterly Services Survey 10:00 AM ET
- Baker Hughes Rig Count 1:00 PM ET