Perspective is at the heart of understanding market conditions, the business environment, and economics as a whole. Ideally, that perspective is shaped by data and the accurate historical patterns derived from said data. Understanding historical economic and market patterns can shed light on what we can expect from the future. The better we can anticipate the future, the more successful we will become in the present. With that in mind, we look to the future from the perspective of the past, but the unique period in history we currently find ourselves in may make future guidance more challenging this time around.
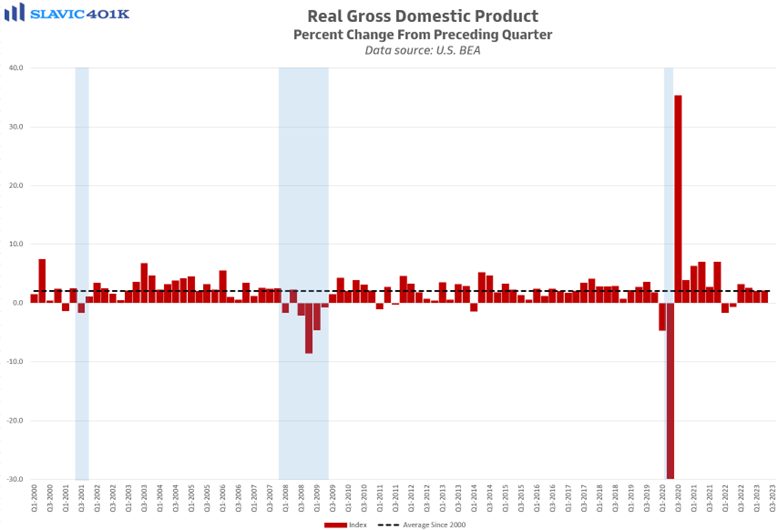
The chart below illustrates quarterly growth in our country’s inflation-adjusted Gross Domestic Product (GDP), i.e., the total value of the goods and services produced in America during a given time. The chart begins in 2000 and continues through present day, a 23-year period that encompasses the brief recession of 2001, the 9/11 attacks, the Great Recession (the deepest and longest economic downturn since the Great Depression).
The tectonic economic jarring of the pandemic produced by shutdowns and the subsequent monetary stimulus by the Federal Reserve Board and the fiscal stimulus by Congress and two presidential administrations.
In all, $6 trillion were pumped into the economy within a span of a little more than a year and a half. To provide a little perspective, if $1 equals one second, it would take over 31,709 years (longer than recorded human history) to reach $1 trillion. Six times that was the amount of money pumped into the economy in just 18 months. Consequently, we find ourselves in an unprecedented environment that makes predicting the future so much more difficult.
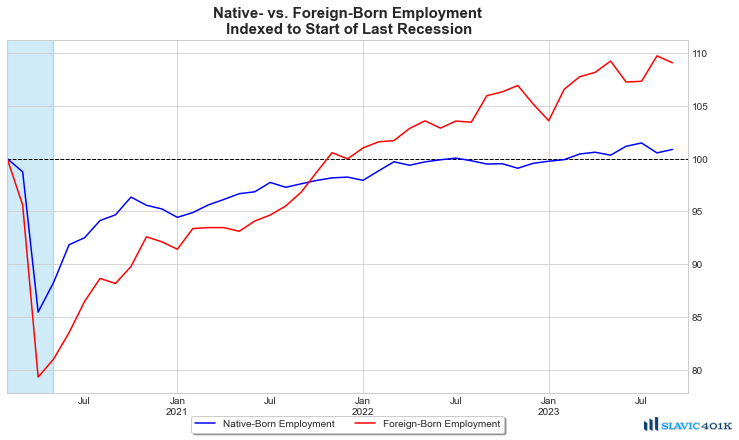
The tight labor market in the post-pandemic economy is a direct consequence of many workers opting not to return to the workforce, notably women and those workers who were either at or near retirement age. Consequently, the labor force participation rate has only rebounded to 62.8%, as of September 2023. This means that roughly one-in-three potential workers are not actually taking jobs. Further, essentially all new job growth, relative to pre-pandemic levels, can be attributed to foreign-born individuals rather than native-born workers. This, in part, explains why there is strong demand for labor alongside a limited labor supply.
Overall, the labor market is not as “tight” as it was a year ago, but “less tight” is still a long way from “loose.” Moreover, the increasing number of union strikes across a wide array of industries indicates the muscle in the labor market remains strong because of supply and demand principles at work. When demand significantly outstrips supply in the labor market, it results in upward pressure on wages like we have seen in recent years. From a sentiment perspective, most surveyed workers don’t “feel” like they are making more money, despite escalating wages, because in fact they are not. When adjusted for inflation, the buying power of workers has decreased in recent years. This is especially true for workers in lower-wage industries who remain much more sensitive to a price shock at the grocery store than higher-income cohorts.
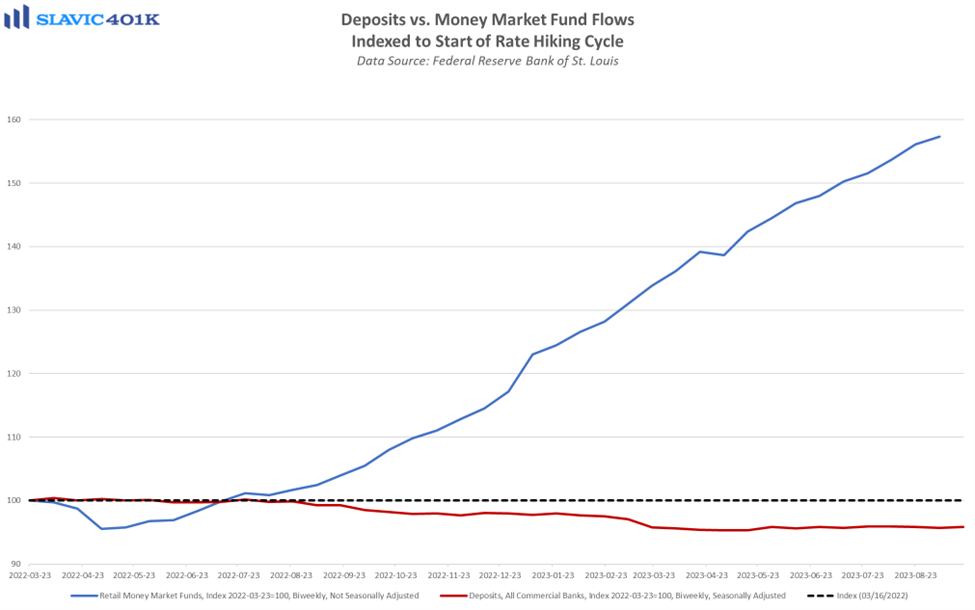
Another good predictor of future economic conditions is the stock market, which generally has an anticipatory lead time of roughly 9-12 months. This discounting mechanism is not perfect, but is a good guide. The markets over the last month have retreated due to concern that inflation is more resilient than previously thought. Bond market yields have risen incessantly, meaning that the market has raised rates, and not the Fed. So, both the stock and bond markets have worked in concert, with a singular view of inflation. What we can expect is potential normalization of the two markets, with a recovery in stocks and a taming of the strong rates environment. An additional variable is money markets now paying 5% or more with essentially no risk compared to the volatility of the stock market.
Let me conclude with the stock market as a future indicator. From a macro perspective, the market looks nine months to a year into the future. The fact that it hasn’t fallen substantially from all-time highs indicates that there is a relatively positive expectation on the part of analysts and investors. This view is likely assuming a “soft landing” into a mild recession or period of slower growth following the tectonic shifts of the past few years. Second, the “follow the money” market bet is clearly on technology. Specifically, the rise of AI technologies. The transformative potential of AI is likely to have a greater near-term impact on the higher-order tasks of white-collar jobs than the manual labor associated with blue-collar work. In socioeconomic terms, this could be a very healthy development as the shrinking middle class (and prime-age workforce) that our economy, politics, and society has historically depended on, may in fact, resurge in the wake of AI.
Altogether, there are several reasons to remain optimistic about the future. , At the same time, when looking at the recent past for guidance on the transformation of the economy, expect the unexpected. For retirement investors, though, the only guaranteed way to lose money to inflation over the long run is to not invest their savings at all. There have been extended periods when stock market returns were negative on a real basis, but we must combine such inflationary busts with the booms that precede and follow. Consider the years 1966-1981. Inflation ran very hot over this stretch and the stock market struggled to keep up, resulting in negative real returns. However, from the perspective of a retirement investor, that is a very narrow time horizon relative to their entire working career.
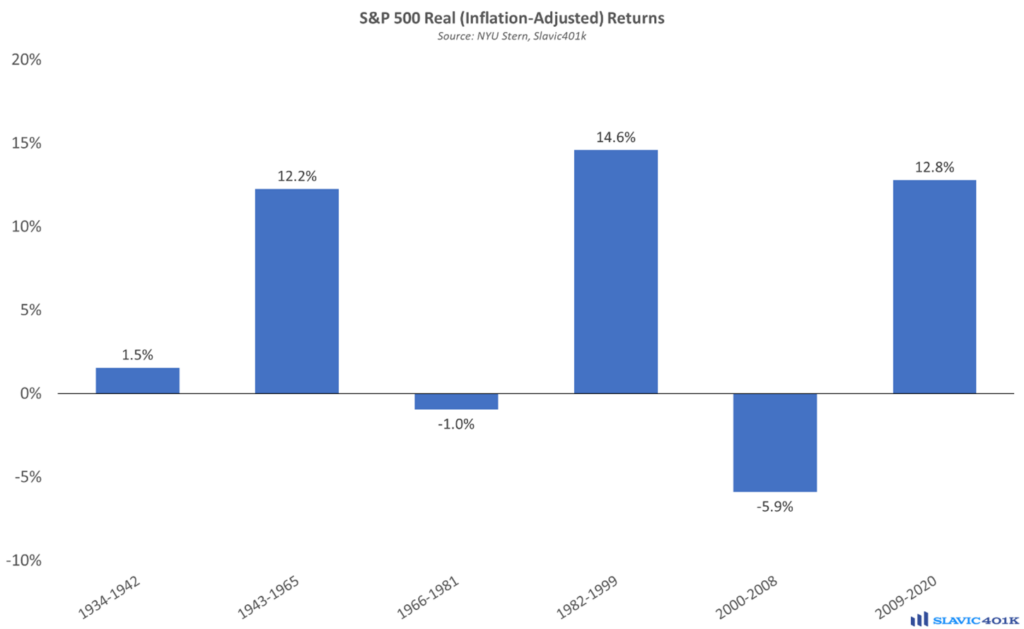
Consider now the periods from 1943-1981 and 1966-1999. Both of those windows include the inflationary bust of 1966-1981, but both were also able to generate positive real returns of roughly 7% thanks to the various boom periods that occurred throughout the longer time horizons. The same applies when we combine other down cycles with up cycles, e.g., the boom of the 1980s and 1990s smoothed out the bust from 2000-2008, as was being invested since 2009. The key takeaway is that the best way to offset periods of low inflation-adjusted returns is to invest during periods of high inflation-adjusted returns. Predicting when each boom-and-bust cycle will occur is very difficult, but it is a problem retirement investors can circumvent with decades of persistent participation in the market.
Like John’s content? Read more of John’s market commentary and market wrap-ups.